Fetch OHLC Candles
Solana OHLC candles API with clean USD price data. Fetch volume, trade count, and reliable price history from vetted markets for charting and analysis.
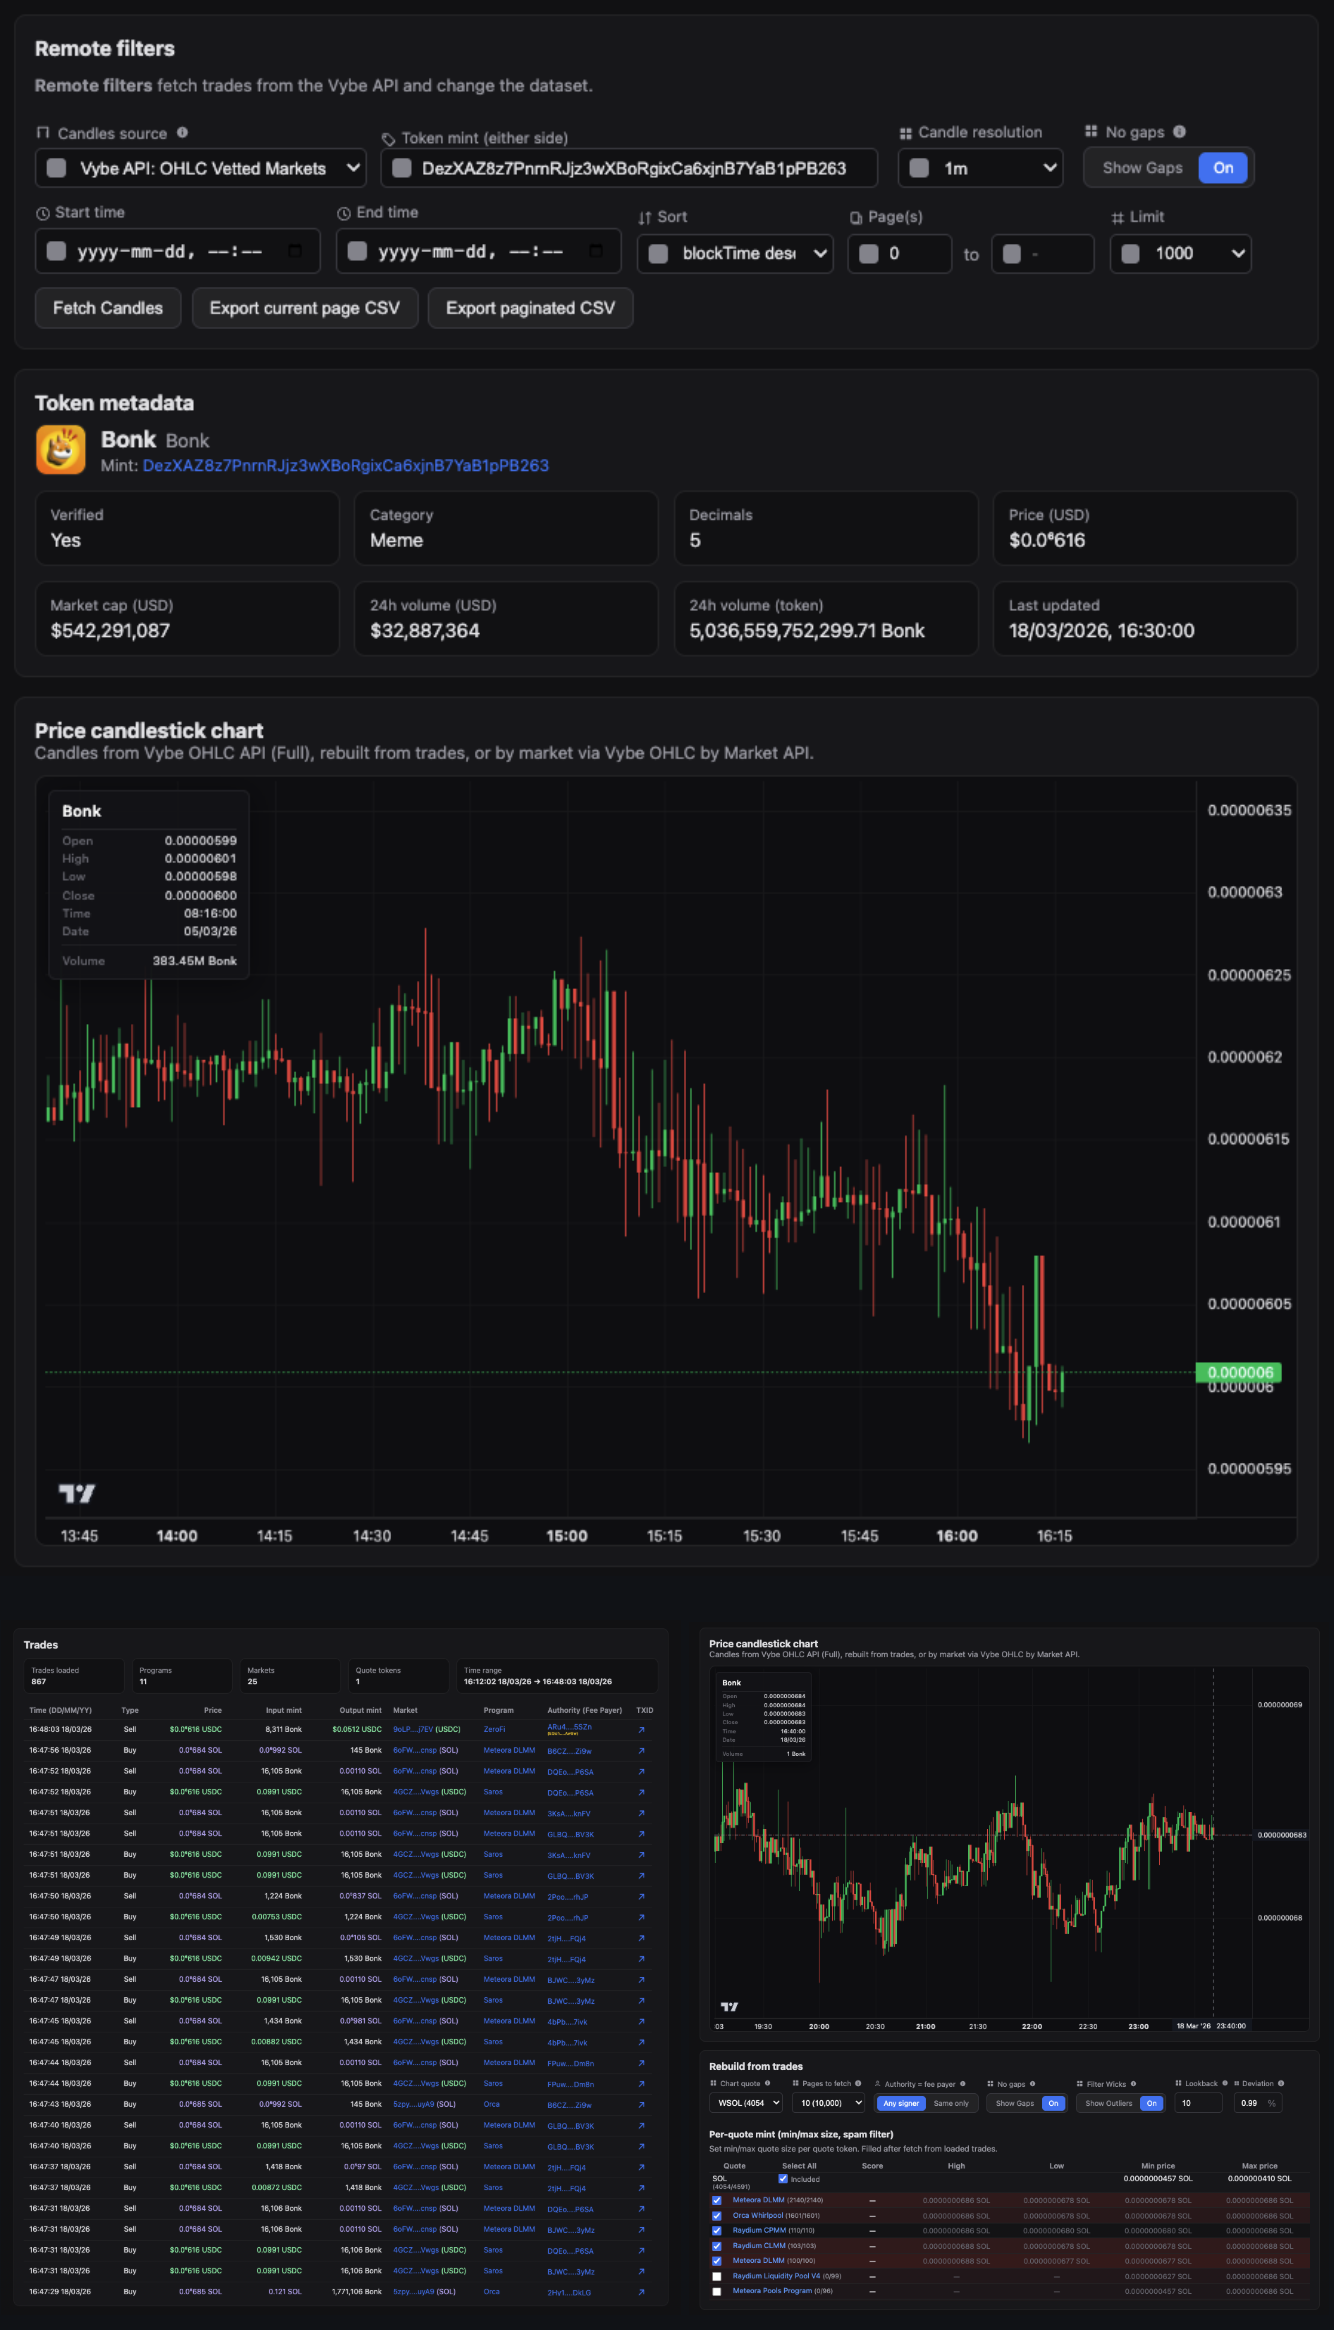
Retrieve clean and reliable OHLC candle data for any Solana token with USD-denominated pricing sourced from vetted liquidity pools. Access open, high, low, close, volume, and trade count across multiple timeframes to power charts, backtesting systems, alerts, and quantitative analysis.
Designed to eliminate noise from illiquid or manipulated markets, this dataset provides accurate price history for building professional-grade trading and analytics tools on Solana. Data is aggregated from vetted USDC, USDT, PYUSD, and wSOL markets only, so your charts avoid fake wicks and manipulated pools.
Why This Endpoint?
Token candles answer: "What did the price do over time?"
The Vybe token candles endpoint provides:
- OHLC in USD at multiple resolutions (1m up to 1y)
- Volume and trade count per candle
- Vetted markets only – no junk or wash-traded pools
- Gap handling – optional
eliminateCloseToOpenGapsto smooth candle continuity - Flexible time range via
timeStartandtimeEnd(unix timestamps)
Use it for charting, backtesting, alerts, and any token analytics that need clean, trustworthy price history.
Demo for OHLC Candlestick Data API
The free live demo for these endpoints can be found here:
- Live demo: https://solana-ohlc-candlestick-data-api.vybenetwork.com
- GitHub repo: https://github.com/vybenetwork/solana-ohlc-candlestick-data-api
You can visit this link to access and try the demo: https://solana-ohlc-candlestick-data-api.vybenetwork.com
Endpoint
GET /v4/tokens/{mintAddress}/candlesReplaces: GET price/{mintAddress}/token-ohlcv
Parameters
| Parameter | Type | Description |
|---|---|---|
mintAddress | string | Token mint public key (path, required) |
resolution | string | Candle size: 1m, 3m, 5m, 15m, 30m, 1h, 2h, 3h, 4h, 1d, 1w, 1mo, 1y. Default 1h |
timeStart | number | Start time (unix timestamp). Default: 2 weeks ago |
timeEnd | number | End time (unix timestamp). Default: now |
limit | number | Max candles per page (default 1000) |
page | number | Page for pagination (0-indexed) |
eliminateCloseToOpenGaps | boolean | Use previous close as next open to remove gaps. Default true |
Example Request
curl "https://api.vybenetwork.com/v4/tokens/So11111111111111111111111111111111111111112/candles?resolution=1h&limit=24" \
  -H "X-API-Key: YOUR_API_KEY"
Example Response
{
  "data": [
    {
      "time": 1769454000,
      "open": "124.818453303640276994",
      "high": "125.889046941678518274",
      "low": "122.860020140986908674",
      "close": "124.341895651644702722",
      "volume": "12975664.100103864949191661",
      "volumeUsd": "1613418671.545907039739280571076830566546401242",
      "count": 45071
    },
    {
      "time": 1769457600,
      "open": "124.282278176709705730",
      "high": "125.301204819277119490",
      "low": "122.564656900186505218",
      "close": "123.601153003103698946",
      "volume": "12152233.228473412059815012",
      "volumeUsd": "1502030038.601943033899999556107907541699377352",
      "count": 44837
    }
  ]
}
Response Fields Explained
| Field | Description |
|---|---|
time | Candle start time (unix timestamp) |
open | Open price (USD) |
high | High price (USD) |
low | Low price (USD) |
close | Close price (USD) |
volume | Token volume in base units |
volumeUsd | Volume in USD |
count | Number of trades in the interval |
Common Use Cases
| Use Case | Implementation |
|---|---|
| Price chart | Request 1h or 1d candles, plot OHLC or close |
| Backtesting | Use 1m/5m/15m with timeStart/timeEnd for historical range |
| Alerts | Poll candles and compare close to thresholds |
| Spread / volatility | Use high and low from 1h or 1d candles |
| Volume overlay | Use volumeUsd or volume alongside price |
Best Practices
Pick the right resolution
- 1m–15m – Short-term trading, scalping, live charts
- 1h–4h – Swing trading, daily analysis
- 1d–1w – Research, trend and support/resistance
- 1mo–1y – Long-term trend and macro view
Constrain the range
Always set timeStart and/or timeEnd when you need a specific window; without them you get the default (e.g. last 2 weeks). Use limit and page for large ranges.
Gap handling
eliminateCloseToOpenGaps=true (default) makes each candle’s open equal the previous close, which avoids artificial gaps when liquidity moves between pools. Set to false only if you need raw exchange-style OHLC.
Combine with markets
For pool-specific charts, use Market Candles with a marketId from Fetch Markets/Pools.
Related Endpoints
- Token Details & Metrics – Current price, volume, market cap
- Fetch Markets/Pools – List markets for a DEX (for market-level candles)
- Market Price Candles – OHLC for a specific market/pool
- Live 1 Minute Candles – WebSocket live candles
Updated about 2 months ago