Historical Wallet Balances
Solana wallet portfolio and holdings value API with daily snapshots. Get 30 days of balance history for net worth charts, performance and drawdowns.
Why Balance History Matters
Point-in-time portfolio snapshots unlock powerful use cases:
- Performance tracking: Calculate returns over any period
- Net worth charts: Visualize portfolio growth
- Drawdown analysis: Identify max losses from peaks
- Reporting: Generate weekly/monthly summaries
- Attribution: See which tokens drove gains or losses
Without historical data, you can only see what a wallet holds now. With balance history, you can see the complete picture of how a portfolio evolved.
Endpoint
GET /wallets/{ownerAddress}/token-balance-tsParameters
| Parameter | Type | Description |
|---|---|---|
ownerAddress | string | Wallet public key (required) |
days | number | Days of history: 1-30 (default: 14) |
Example Request
curl "https://api.vybenetwork.com/wallets/7Tar8QZTrRPwoGY5Ke9Vfwf6CmpBfekrNofERxgReza/token-balance-ts?days=7" \
  -H "X-API-Key: YOUR_API_KEY"
Example Response
{
  "ownerAddress": "7Tar8QZTrRPwoGY5Ke9Vfwf6CmpBfekrNofERxgReza",
  "data": [
    {
      "date": "2024-01-15",
      "totalValueUsd": "15234.56",
      "totalValueSol": "82.15",
      "tokens": [
        {
          "mintAddress": "So11111111111111111111111111111111111111112",
          "symbol": "SOL",
          "amount": "50.5",
          "valueUsd": "9363.71"
        },
        {
          "mintAddress": "EPjFWdd5AufqSSqeM2qN1xzybapC8G4wEGGkZwyTDt1v",
          "symbol": "USDC",
          "amount": "5000.00",
          "valueUsd": "5000.00"
        }
      ]
    },
    {
      "date": "2024-01-14",
      "totalValueUsd": "14890.23",
      "totalValueSol": "80.42",
      "tokens": [...]
    }
  ]
}
Response Fields
| Field | Description |
|---|---|
date | Snapshot date (YYYY-MM-DD) |
totalValueUsd | Total portfolio value in USD |
totalValueSol | Total portfolio value in SOL |
tokens | Array of token holdings on that date |
tokens[].amount | Token quantity held |
tokens[].valueUsd | Value of that holding |
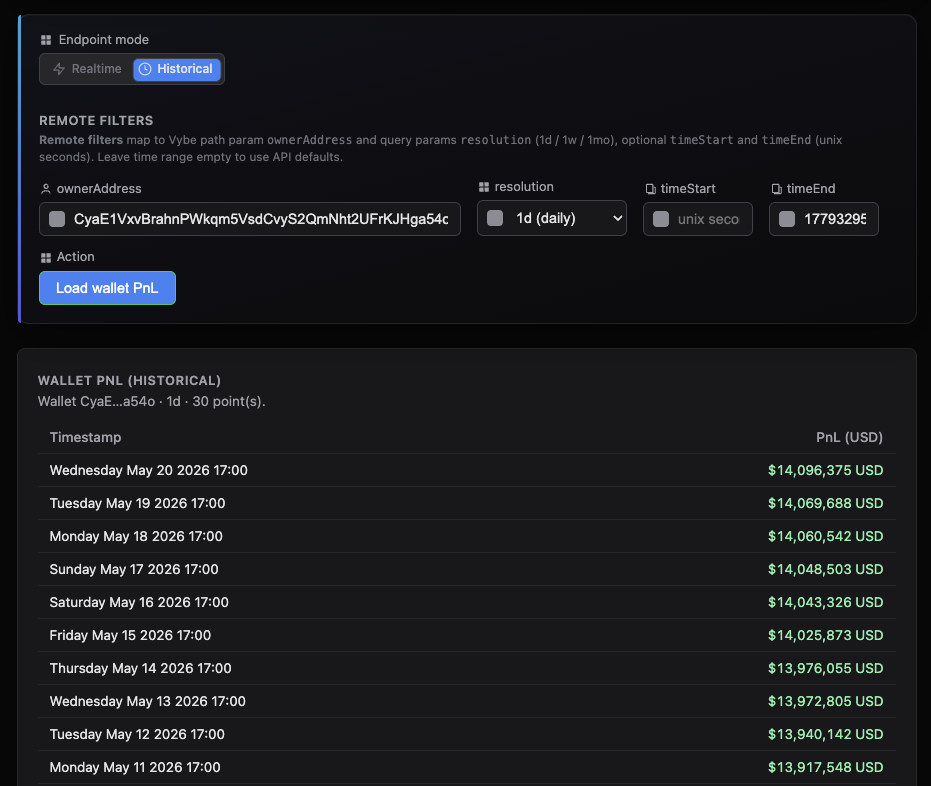
Demo for Historical Wallet Profit & Loss API
The free live demo for the historical profit and loss per wallet endpoint can be found here:
Common Use Cases
| Use Case | Implementation |
|---|---|
| Portfolio Chart | Line chart of net worth over time |
| Performance Metrics | Daily/weekly/monthly returns |
| Drawdown Analysis | Max decline from portfolio peak |
| Periodic Reports | Weekly or monthly summaries |
| Attribution | Which tokens drove performance |
| Comparison | Compare wallet performance to benchmarks |
Portfolio Chart Example
Build a net worth chart for any wallet:
async function getPortfolioChart(wallet, days = 30) {
  const response = await fetch(
    `https://api.vybenetwork.com/wallets/${wallet}/token-balance-ts?days=${days}`,
    { headers: { "X-API-Key": API_KEY } }
  );
  const { data } = await response.json();

  // Format for Chart.js, Recharts, or any charting library
  const chartData = data.reverse().map(day => ({
    date: new Date(day.date),
    label: day.date,
    valueUsd: parseFloat(day.totalValueUsd),
    valueSol: parseFloat(day.totalValueSol)
  }));

  return chartData;
}
Performance Metrics Example
Calculate comprehensive performance statistics:
async function calculatePerformance(wallet, days = 30) {
  const response = await fetch(
    `https://api.vybenetwork.com/wallets/${wallet}/token-balance-ts?days=${days}`,
    { headers: { "X-API-Key": API_KEY } }
  );
  const { data } = await response.json();

  // Sort chronologically
  const sorted = [...data].reverse();
  const values = sorted.map(d => parseFloat(d.totalValueUsd));

  // Basic metrics
  const startValue = values[0];
  const endValue = values[values.length - 1];
  const absoluteReturn = endValue - startValue;
  const percentReturn = ((absoluteReturn / startValue) * 100);

  // Peak and drawdown
  let peak = values[0];
  let maxDrawdown = 0;
  let maxDrawdownDate = sorted[0].date;

  for (let i = 0; i < values.length; i++) {
    if (values[i] > peak) {
      peak = values[i];
    }
    const drawdown = ((peak - values[i]) / peak) * 100;
    if (drawdown > maxDrawdown) {
      maxDrawdown = drawdown;
      maxDrawdownDate = sorted[i].date;
    }
  }

  // Volatility (standard deviation of daily returns)
  const dailyReturns = [];
  for (let i = 1; i < values.length; i++) {
    dailyReturns.push((values[i] - values[i-1]) / values[i-1] * 100);
  }
  const avgReturn = dailyReturns.reduce((a, b) => a + b, 0) / dailyReturns.length;
  const volatility = Math.sqrt(
    dailyReturns.reduce((sq, r) => sq + Math.pow(r - avgReturn, 2), 0) / dailyReturns.length
  );

  return {
    period: `${days} days`,
    startValue: `$${startValue.toLocaleString()}`,
    endValue: `$${endValue.toLocaleString()}`,
    absoluteReturn: `${absoluteReturn >= 0 ? '+' : ''}$${absoluteReturn.toLocaleString()}`,
    percentReturn: `${percentReturn >= 0 ? '+' : ''}${percentReturn.toFixed(2)}%`,
    maxDrawdown: `${maxDrawdown.toFixed(2)}%`,
    maxDrawdownDate,
    dailyVolatility: `${volatility.toFixed(2)}%`,
    bestDay: Math.max(...dailyReturns).toFixed(2) + '%',
    worstDay: Math.min(...dailyReturns).toFixed(2) + '%'
  };
}
Token Attribution Example
See which tokens drove portfolio performance:
async function getPerformanceAttribution(wallet) {
  const response = await fetch(
    `https://api.vybenetwork.com/wallets/${wallet}/token-balance-ts?days=7`,
    { headers: { "X-API-Key": API_KEY } }
  );
  const { data } = await response.json();

  const oldest = data[data.length - 1]; // Oldest snapshot
  const newest = data[0]; // Most recent

  // Build map of starting values
  const startValues = {};
  oldest.tokens.forEach(t => {
    startValues[t.mintAddress] = parseFloat(t.valueUsd);
  });

  // Calculate each token's contribution
  const attribution = newest.tokens.map(token => {
    const startValue = startValues[token.mintAddress] || 0;
    const endValue = parseFloat(token.valueUsd);
    const change = endValue - startValue;

    return {
      symbol: token.symbol,
      mintAddress: token.mintAddress,
      startValue: `$${startValue.toLocaleString()}`,
      endValue: `$${endValue.toLocaleString()}`,
      change: `${change >= 0 ? '+' : ''}$${change.toLocaleString()}`,
      isNew: !startValues[token.mintAddress]
    };
  }).sort((a, b) => {
    // Sort by absolute change
    const aChange = parseFloat(a.change.replace(/[$,+]/g, ''));
    const bChange = parseFloat(b.change.replace(/[$,+]/g, ''));
    return Math.abs(bChange) - Math.abs(aChange);
  });

  return {
    period: '7 days',
    topGainers: attribution.filter(t => parseFloat(t.change.replace(/[$,+]/g, '')) > 0).slice(0, 5),
    topLosers: attribution.filter(t => parseFloat(t.change.replace(/[$,+]/g, '')) < 0).slice(0, 5),
    newPositions: attribution.filter(t => t.isNew)
  };
}
Multi-Wallet History
Track multiple wallets together for fund or DAO dashboards:
POST /wallets/batch/token-balance-tscurl -X POST "https://api.vybenetwork.com/wallets/batch/token-balance-ts" \
-H "X-API-Key: YOUR_API_KEY" \
-H "Content-Type: application/json" \
-d '{
"wallets": [
"Wallet1PublicKey...",
"Wallet2PublicKey...",
"Wallet3PublicKey..."
],
"days": 14
}'This returns aggregated history across all wallets—perfect for tracking a fund's total AUM over time.
Related Endpoints
- Token Balances - Current portfolio snapshot
- Batch Queries - Multi-wallet aggregation
- DeFi Positions - Include DeFi in portfolio
Updated 6 days ago