Network Graph
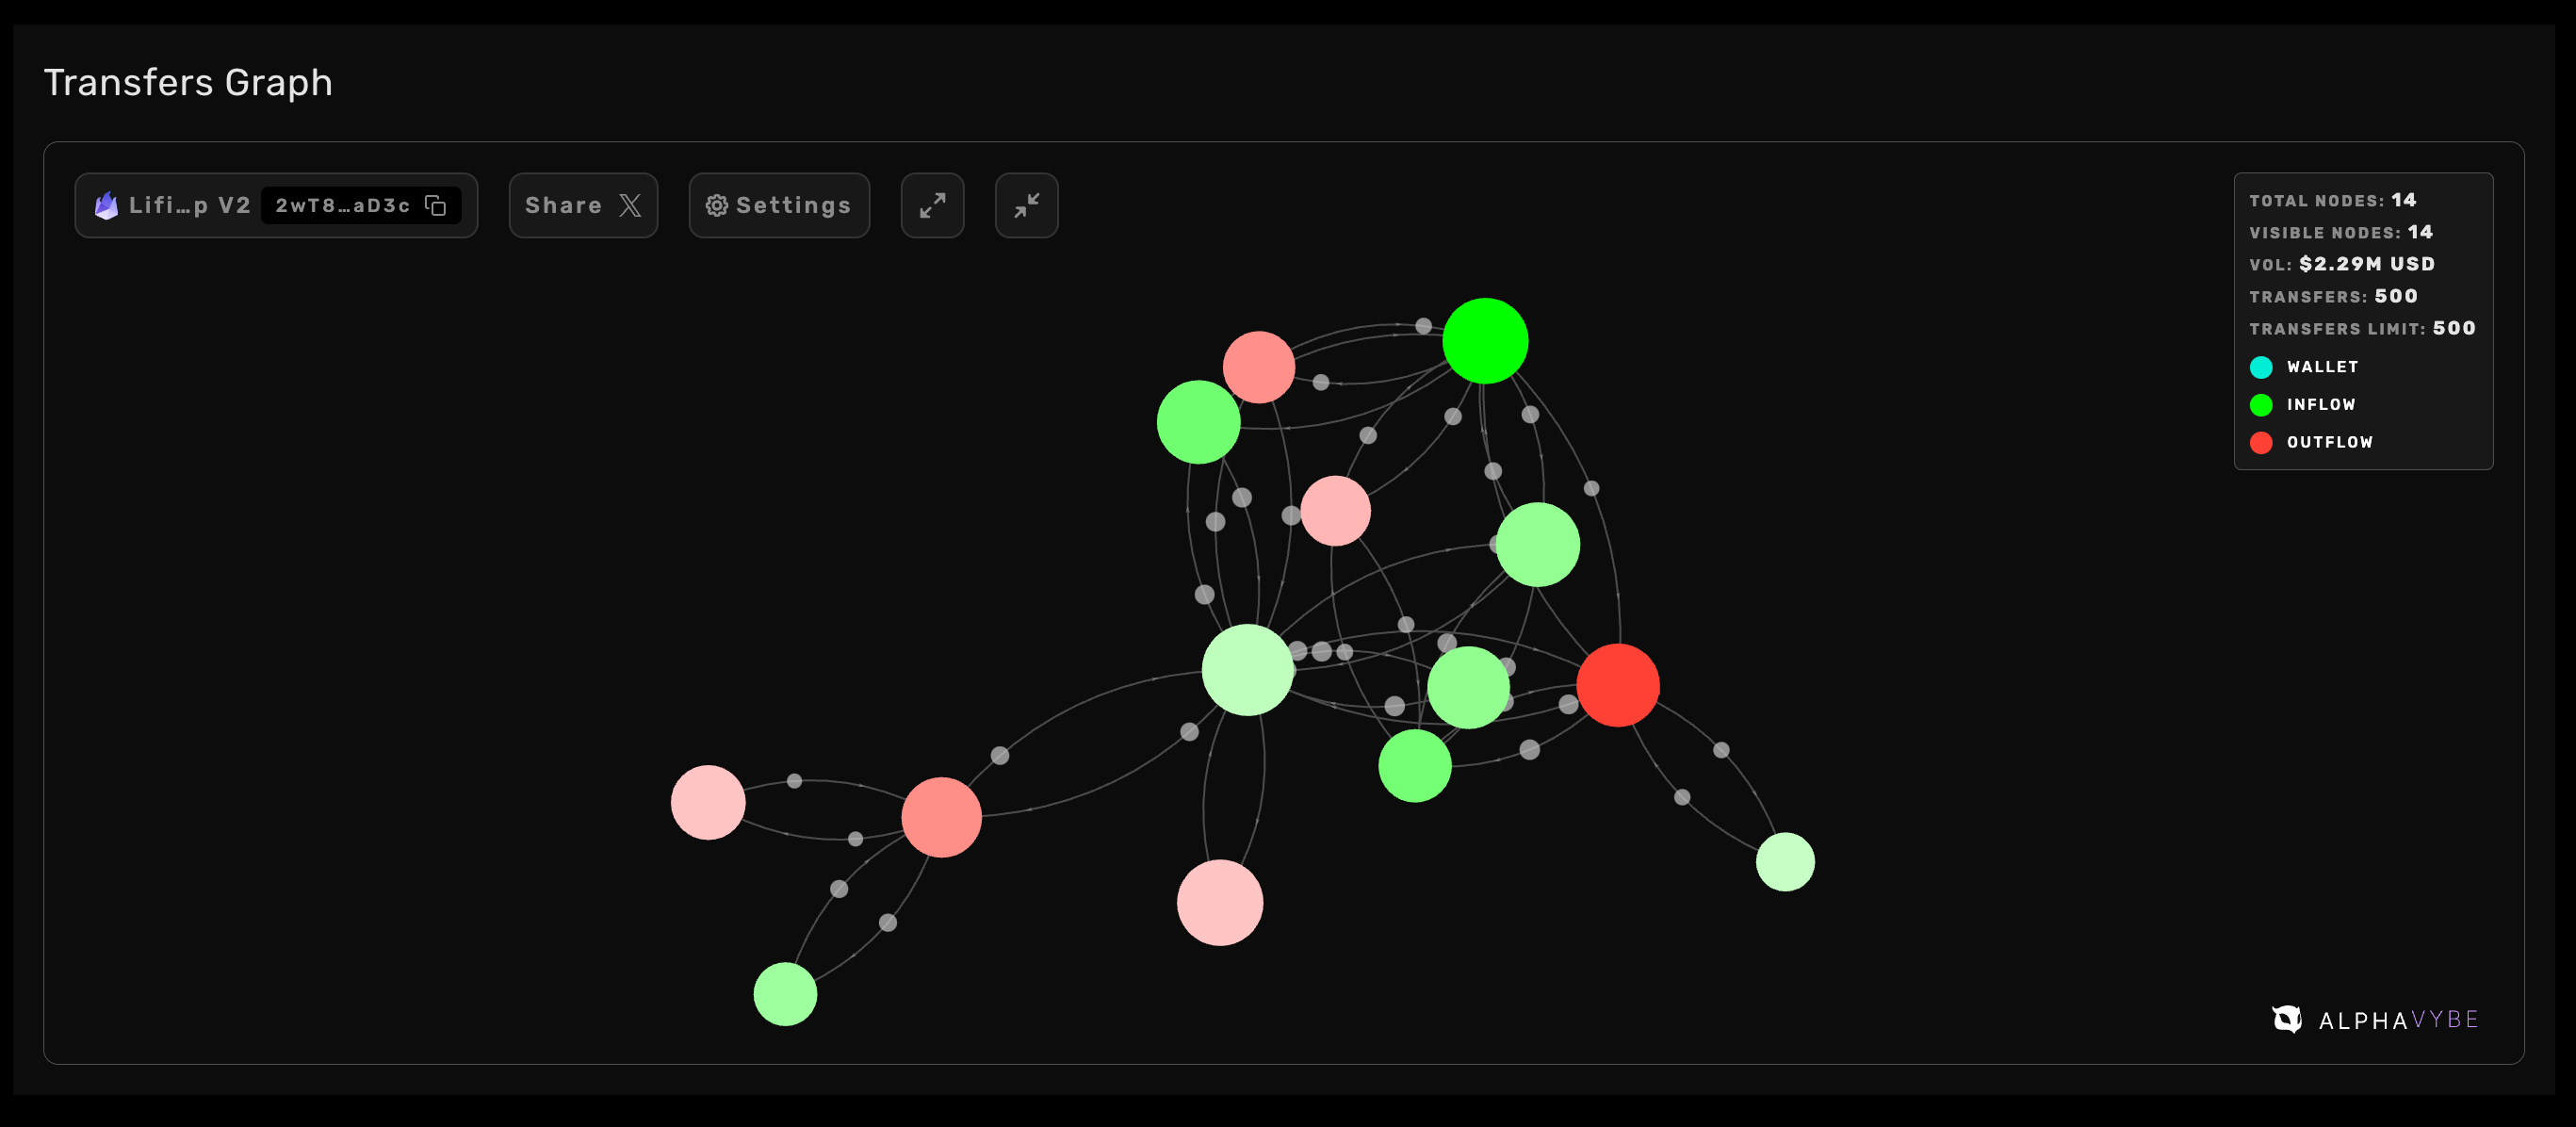
This image illustrates a typical view of the network graph widget, showcasing the relationships and transfers between different entities on the Solana blockchain.
Overview
The Network Graph Widget is a powerful tool designed to visualize the relationships between wallets, programs, and tokens on the Solana blockchain. This widget allows users to explore and analyze the flow of tokens, providing insights into the interactions within the blockchain ecosystem.
Widget URL
You can access the widget at the following URL: https://widget.vybenetwork.com/network-graph
Configuration via URL Parameters
The widget's behavior and display can be customized through URL parameters:
💡 URL parametersURL parameters are the string of key-value pairs appended to a URL. They provide a named variable and an associated text value for the application to use for configuration. URL parameters begin after a question mark (?) at the end of a URL. Each parameter contains a key and a value joined with an equals sign (=). Multiple parameters can be added by joining the key-value pairs with an ampersand sign (&). Query string
Parameters:
address: The entity's public key that you want the graph to focus on.
entity: Specifies the type of entity the address belongs to. Options should represent the type of entity used in the address parameter.
token: the specified address is a token mint.
program: the specified address is a Program ID or PID.
wallet: the specified address is a wallet Public Key.
connectionNode: This optional parameter determines how connections between wallets are displayed:
program: Shows the Solana program used for token transfers. (This is the default selection if the param is omitted)
token: Displays the token that was transferred.
wallet: Direct connection between wallets without an intermediate node.
Integration:
The network graph widget can be integrated into any website using an iframe element. Here is an example code snippet to do this.
To enable the Copy to Clipboard option, you must allow the
clipboard-writepermission.
<iframe
  src="https://widget.vybenetwork.com/network-graph?address=DezXAZ8z7PnrnRJjz3wXBoRgixCa6xjnB7YaB1pPB263&entity=token&connectionNode=program"
  title="vybe-network-graph"
  allow="clipboard-write"
></iframe>
Data Source
The graph utilizes a historical database that records all token transfers on the Solana blockchain. The data spans up to 6 months, but the widget considers a maximum of 1000 historical transfers for each entity. Here's how the data is aggregated:
- Wallet Nodes: Grouped by public key.
- Program Nodes: Grouped by Program ID (PID).
- Token Nodes: Grouped by mint address.
The aggregation includes:
- Summing the value of transfers between wallets.
- Calculating the total volume in USD.
- Determining the inflow and outflow of USD value between wallets.
User Interface Controls
The widget includes a toolbar with several controls to manipulate the graph:
- Connection Node: Toggle between Token, Program, or Neither (direct wallet connections).
- Transfer count: Adjust from 100 to 1000 to limit the number of historical transfers shown.
- Copy address: This button copies the entity address to the clipboard for easy sharing or further analysis.
- Share to X: This option allows you to capture the graph's canvas and share it directly to your X account, with a link back to AlphaVybe for context.
- Center Graph Button: Re-centers the graph view.
- Reset View Button: Resets the zoom level and centers the graph.
Interaction
- Hover Tooltips: Each node and link on the graph provides detailed information on hover, including aggregated volumes and values of the transfers.
- Vybe Deep Linking: Click a node to link back to the Vybe profile page associated with the node’s entity and address.